Single Pane Monitoring for On-Premises, Cloud, and Hybrid Resources
-
 25 July 2022
-
 Press Releases
 -
 Written by
Editorial Team
Written by
Editorial Team
Monitoring servers, services, or resources for any IT team is one of the most important aspects for any organization to run without any disruption. Monitoring also helps in predicting potential problems and hence taking proactive measures to avert any service interruption. Apart from monitoring on-premises resources, in today’s world, many organizations are slowly migrating towards Cloud solutions, and monitoring the Cloud resources is equally important. Many Cloud providers like Azure, AWS, and Google, do provide monitoring services. However, managing multiple monitoring systems is difficult and also leads to missing/overlooking key information.
Challenges with Distributed Resources Monitoring
When it comes to monitoring systems/resources on multiple clouds or hybrid environments, where some resources are on-premises and some are on cloud, multiple monitoring systems are not only difficult to manage, but monitoring parameters also differ in different systems and hence there is no consistency in monitoring. For example, when a domain controller, a customer monitoring system can monitor the Active Directory replication state between the domain controllers. When the same resources are moved to the cloud, such a custom alert system is missing and mostly replaced with a more complex system. Another example can be monitoring SQL databases. An on-premises system may monitor database health status, which cloud resources can also do, but when it comes to monitoring the mirroring state when SQL is configured in a cluster, the parameter is not present in most of the clouds.
Solution
A single pane/portal-based consistent monitoring system is always a preferred solution, which can monitor all resources, be it on-premises, on cloud, or hybrid, where resources can be on multiple clouds or a combination of some resources/servers on-premise and some on the cloud. Just because the system can monitor all these resources, it does not need to be necessarily expensive. You can configure an open source system like Nagios for monitoring resources that are distributed. Here is how easy it is to configure an open-source monitoring system, which can provide a single pane/portal solution for all resources.
Nagios Core Installation and Configuration on CentOS 7:
-
- SSh to your server where you are planning to install Nagios Server.
- Run the below command to install a LAMP stack with Apache, MariaDB, and PHP 7 on the server.
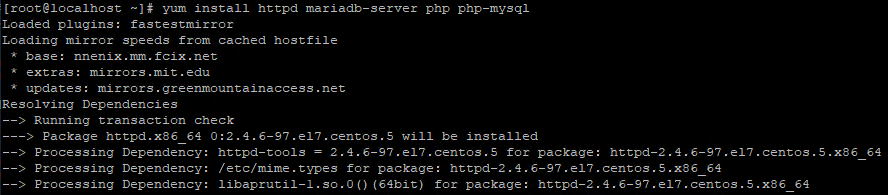
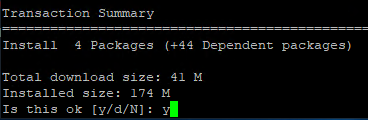
- Wait for the dependencies to be resolved and select y to install the packages when prompted.
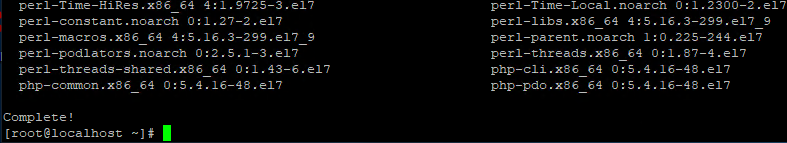
- Wait for the installation of the packages to be completed on the server. You would see something similar as below.
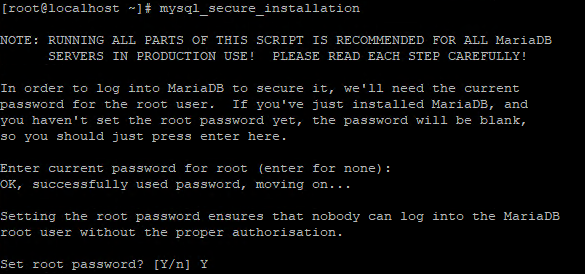
- Then run the following command to secure MariaDB installation and follow the on-screen instructions.
mysql_secure_installation
-
- Run the below commands to enable MariaDB and Apache to start on boot.
systemctl enable httpd.service
systemctl enable mariadb.service
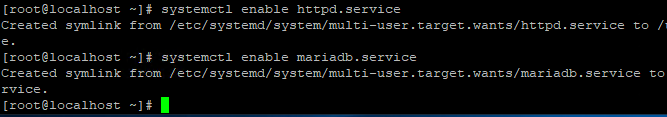
- Run the below commands to enable MariaDB and Apache to start on boot.
-
- Now we will download the latest stable version of the Nagios Core.
First, navigate to the tmp directory on the server with the below command.
cd /tmp
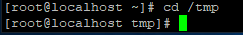
- Now we will download the latest stable version of the Nagios Core.
-
- Run the following
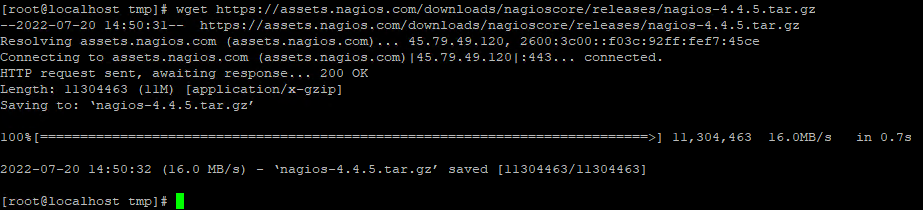 Core 4.4.5 file.
wget https://assets.nagios.com/downloads/nagioscore/releases/nagios-4.4.5.tar.gz
- Run the following
-
- Once the download is complete extract the archive file move to the nagios-4.4.5 directory using the below command and run the following command to configure the installer and prepare the Nagios Core source code for the compilation process.
./configure
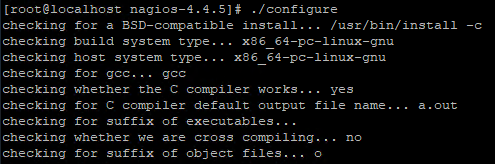
- Once the download is complete extract the archive file move to the nagios-4.4.5 directory using the below command and run the following command to configure the installer and prepare the Nagios Core source code for the compilation process.
-
- After the configuration is completed, run the below command to compile Nagios Core.
make all
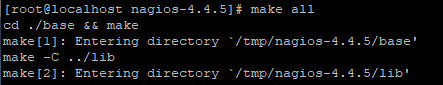
- After the configuration is completed, run the below command to compile Nagios Core.
-
- Run the below commands to create the Nagios user and group and add apache to the Nagios group.
make install-groups-users
usermod -a -G nagios apache
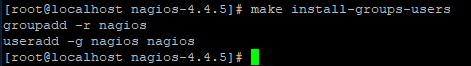

- Run the below commands to create the Nagios user and group and add apache to the Nagios group.
-
- Run the below command to install Nagios Core.
make install
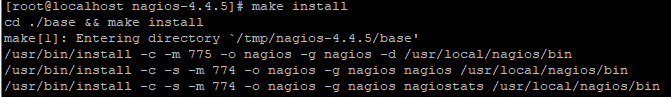
- Run the below command to install Nagios Core.
-
- Run the below command to install the initialization script which can be used to manage the Nagios service.
make install-daemoninit
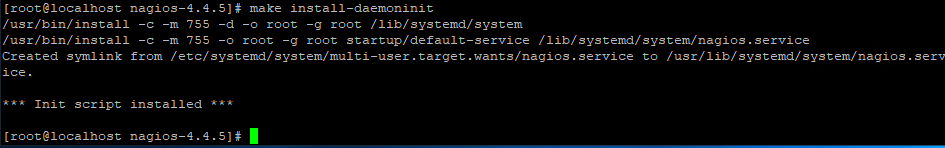
- Run the below command to install the initialization script which can be used to manage the Nagios service.
-
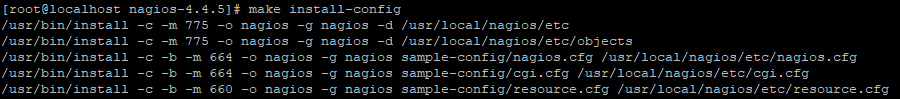
- Run the below command to install the Nagios sample configuration files.
make install-config
- Run the below command to install the Nagios sample configuration files.
-
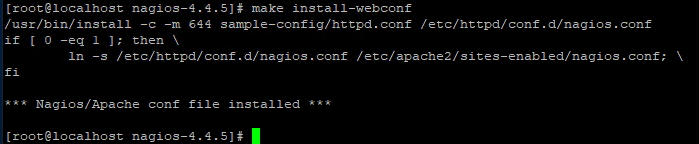
- Run the below command to install the Apache web server configuration files.
make install-webconf
- Run the below command to install the Apache web server configuration files.
-
- Run the below command to install packages that are needed to install Nagios plugins.
yum install gcc glibc glibc-common make gettext automake autoconf wget openssl-devel net-snmp net-snmp-utils epel-release perl-Net-SNMP
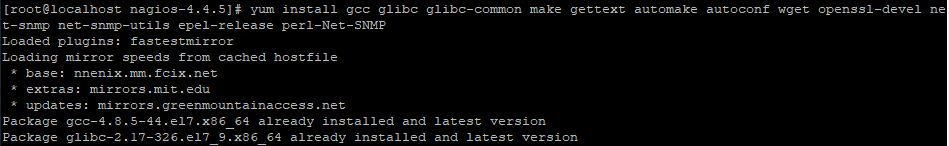
- Run the below command to install packages that are needed to install Nagios plugins.
-
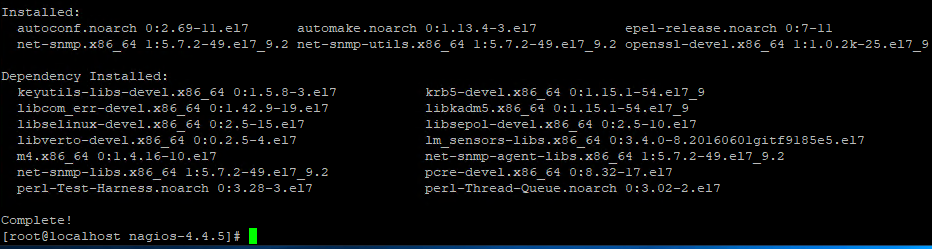
- Wait for the dependencies to be resolved and select y to install the packages when prompted.
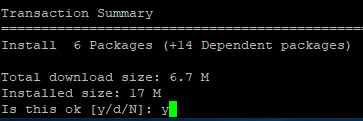
- Wait for the installation of the packages to be completed on the server. You would see something similar as below.
- Use the below command to start Nagios Service on the server.
systemctl start nagios

- Wait for the dependencies to be resolved and select y to install the packages when prompted.
-
- To access Nagios Core, open your browser and navigate to http://YOUR-IP-ADDRESS/nagios and log in using the account you had created during server installation.
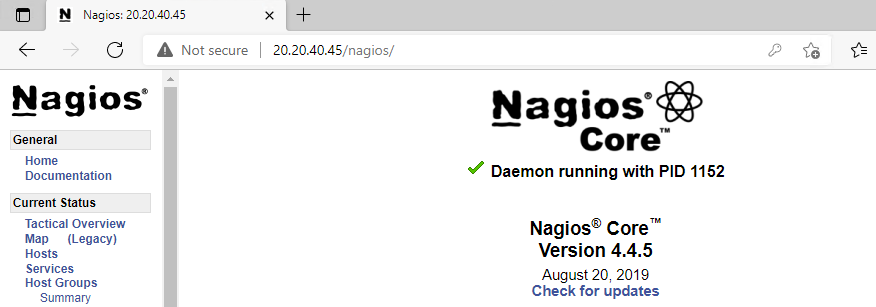
- To access Nagios Core, open your browser and navigate to http://YOUR-IP-ADDRESS/nagios and log in using the account you had created during server installation.
Installation and configuration of Windows OS Monitoring
-
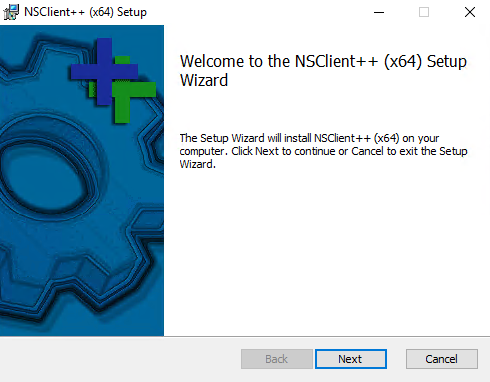
- On the Windows system for which you plan to configure Nagios Monitoring, download the latest version of NSClient from http://nsclient.org/download/
- Once the download is done, run the installer as an administrator to install the application and click on Next.
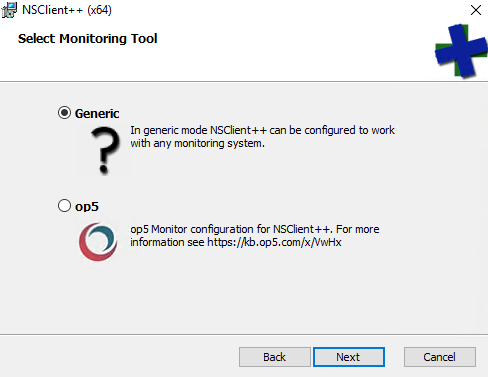
- On the below screen, select Generic and click Next.
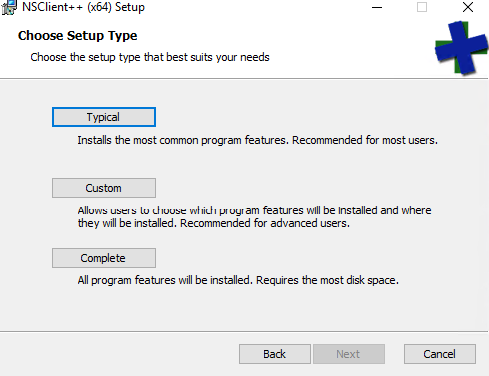
- On the below screen, Select the Typical installation setup type and click Next.
- Once you are on the below screen of the agent configuration window, Edit the default configurations are shown below as follows.
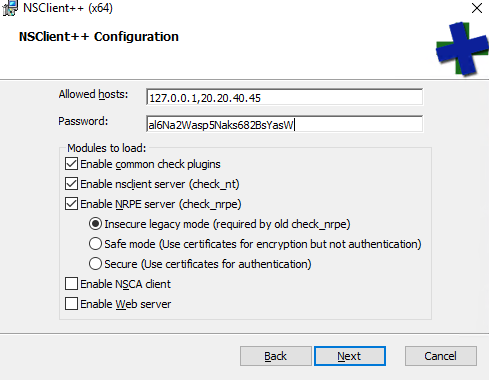
– Under Allowed hosts: Replace the loopback-v6 address, ::1, with the IP of the Nagios Server.
– Under the Password: Delete the existing string and set a Strong Password for use for communication between the Server and the Client. NOTE: The Password must be the same for a group of hosts.
– Under “Modules to load:”, Select the ones as shown in the above screenshot.
-
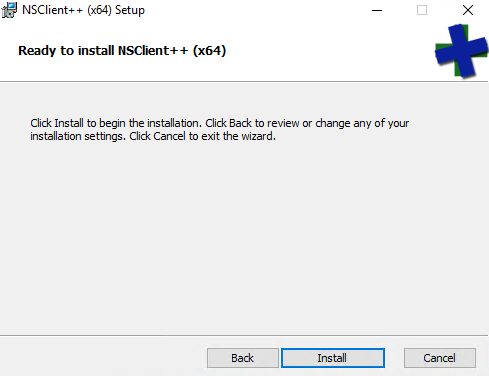
- Click the Next and then the Install button to launch the installation.
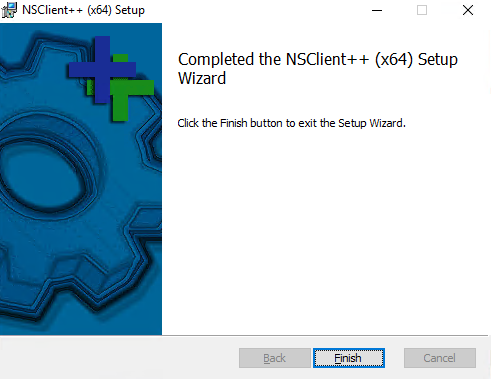
- Once the Installation is complete, click the Finish button to run the client.
- Note that the NSClient service (nscp) will automatically run after installation. It will also set a firewall rule to allow it access. Also, note that nscp service by default listens on port 12489. You can change the port as per your requirement if needed by making changes to C:\Program Files\NSClient++\nsclient.ini file.
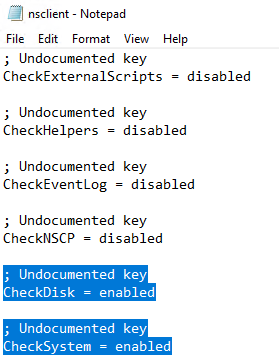
- Open the NSClient configuration file, C:\Program Files\NSClient++\nsclient.ini, with a file editor such as Notepad and enable Disk space as well as System checks that are disabled by default. See the highlighted lines below.
- On the Nagios server and run the below command to see if the Nagios Client is configured properly and it is responding to commands.
/usr/local/nagios/libexec/check_nt -H 20.20.40.40 -p 12489 -s al6Na2Wasp5Naks682BsYasW -v USEDDISKSPACE -l c -w 80 -c 90
In the above command H – is the IP of the Host that has the Nagios Client.
In the above command P – is the port on which the Nagios client is listening.
In the above command S – is the password that you have set during Nagios client installation.
If you get a response as above, that means that your Nagios server is able to talk to your Nagios client and get a response from it.
- Click the Next and then the Install button to launch the installation.
-
- Now we will go ahead and configure Nagios monitoring for the Windows host so that we could see their monitoring status in the Nagios Interface.
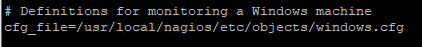
- Login into your Nagios server and edit /usr/local/nagios/etc/nagios.cfg and uncomment and enable Windows Monitoring as shown below.
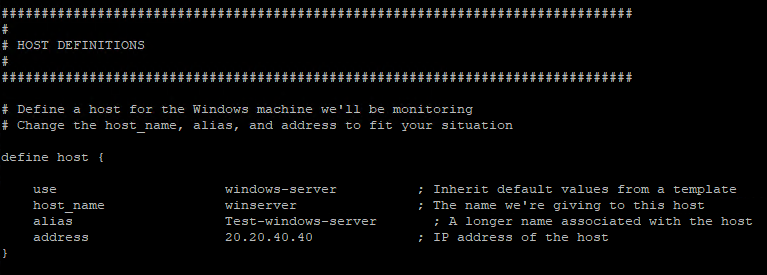
- Now edit /usr/local/nagios/etc/objects/windows.cfg file on Nagios server and enter your Windows Server details as below.
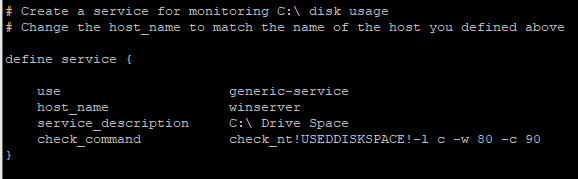
- Now edit /usr/local/nagios/etc/objects/windows.cfg file on the Nagios server and make sure that the below the parameter is defined in the file. This would help us to monitor C drive space on the Windows server.
- Once you see Total Warning and Error as 0, then use the below command to restart the Nagios service on the server so that the Nagios service could start with the new configurations.
systemctl reload nagios

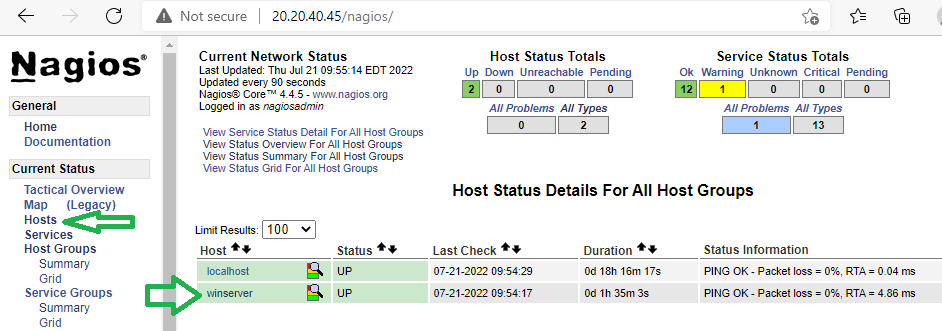
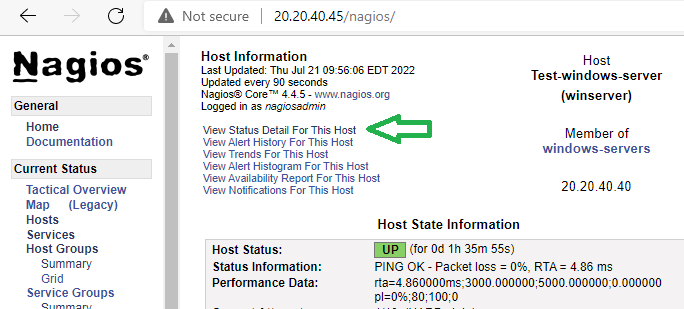
- Now navigate to http://YOUR-IP-ADDRESS/nagios and click on “Hosts” from the left-hand side, you should now see your Windows server there. Now click on your Windows Server name and then click on “View Status Details for this Host”.
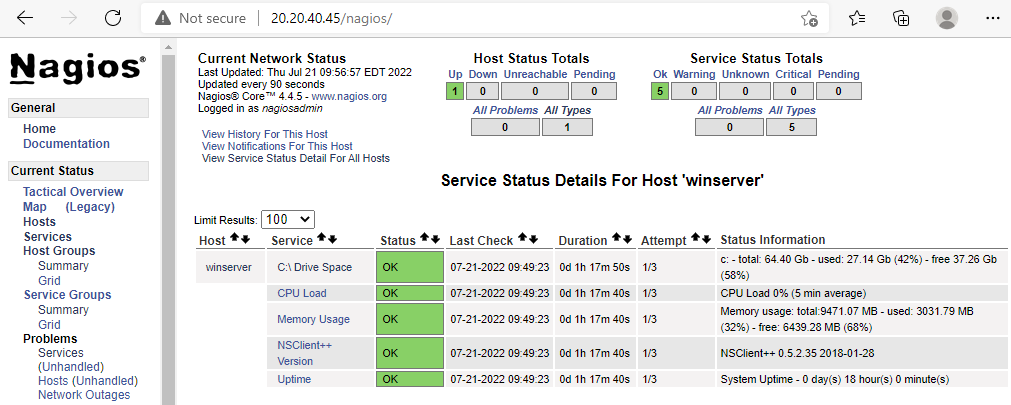
- Now you would see the monitoring parameters that you would have configured for the Windows Server. It would look something like the below.
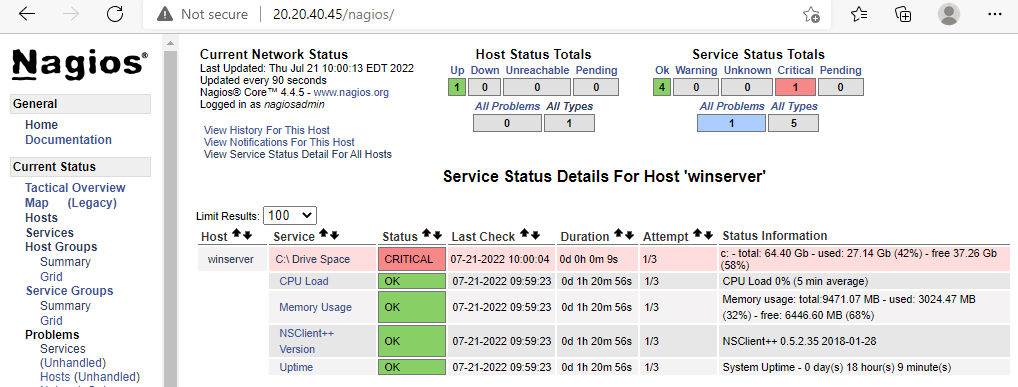
- Once you have configured the monitoring parameters correctly, then once the threshold for the monitoring parameter is crossed, you would see them in either Warning or Critical status depending upon the threshold that has been breached.
Below is an example where the threshold has been crossed for the “C Drive Space” parameter and now we see a critical alert for it.
How Apps4Rent Can Help?
Apps4Rent offers services to configure your own monitoring server. The server can be on-premises or on the cloud based on your requirement. A server on the cloud is a suggested solution and Apps4rent can provide a virtual server on any of the popular Clouds as well as configure monitoring as per your requirement. The monitoring portal can be accessed 24*7 from any PC Windows or MAC and mobile device, which has internet connectivity. Call, chat or email our virtual/remote desktop specialists, available 24/7 for assistance.